Spongy Moth Surveys: 2005 - 2024
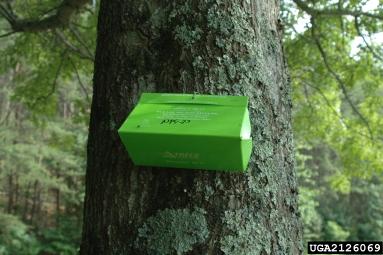
Photo: Chris Evans
Kentucky is nearly surrounded by regulated areas infested with spongy moth in Virginia, West Virginia, Ohio, Indiana and Tennessee. From 2000-2002, West Virginia experienced record defoliations in which over 1 million acres were affected. The possibility of spongy moth spread to Kentucky is very high due to the popularity of Kentucky's recreational areas and the number of people moving into the metropolitan areas from the northeast. We have been surveying for this pest since 1983 and will continue monitoring due to the close proximity of spongy moth present in states surrounding Kentucky on all sides. This extensive trapping program pinpoints potential problems so they may be quickly eradicated before they become infestations that require the expenditure of large amounts of time and money to eradicate.
Triangular delta traps are baited with a synthetic female sex pheromone to attract and capture male spongy moths every year. Detection traps are set throughout the state, covering as much of the state as funding will allow, in order to detect moths. Delimiting traps are extra traps set in an area which previously had several moth captures. Slow the Spread is a program that gives funding to states to intensively trap along the leading edge of the zone which is generally infested with spongy moth to detect populations and allow for quick eradication. In 2022, we implemented a Citizen Science program in which citizens across the state set and monitored spongy moth traps.
The graph below shows numbers of moths captured each year during all survey activities combined.
| Year | Traps Set | Moths Captured | Map with Moth Captures |
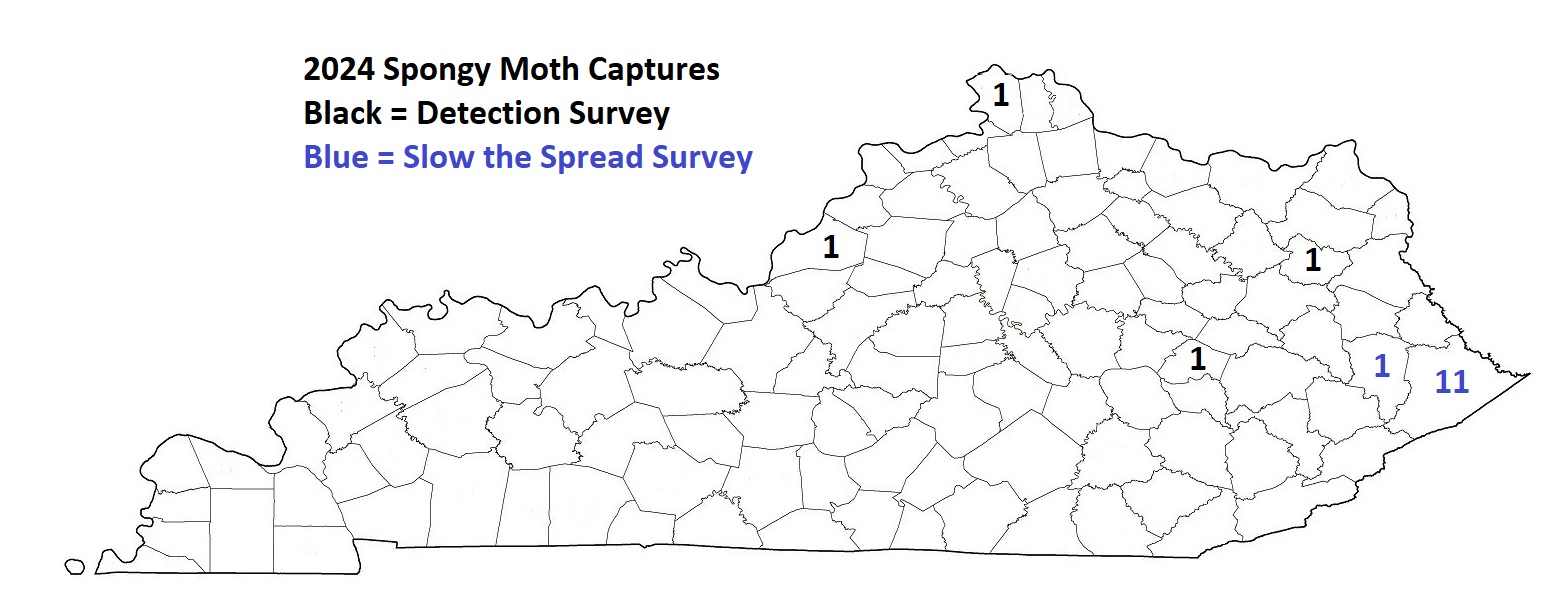
| 2024 |
Detection: 3,023 STS: 765 Citizen Science: 425 |
Detection: 4 in 4 counties STS: 11 in 2 counties Citizen Science: 0 |
 |
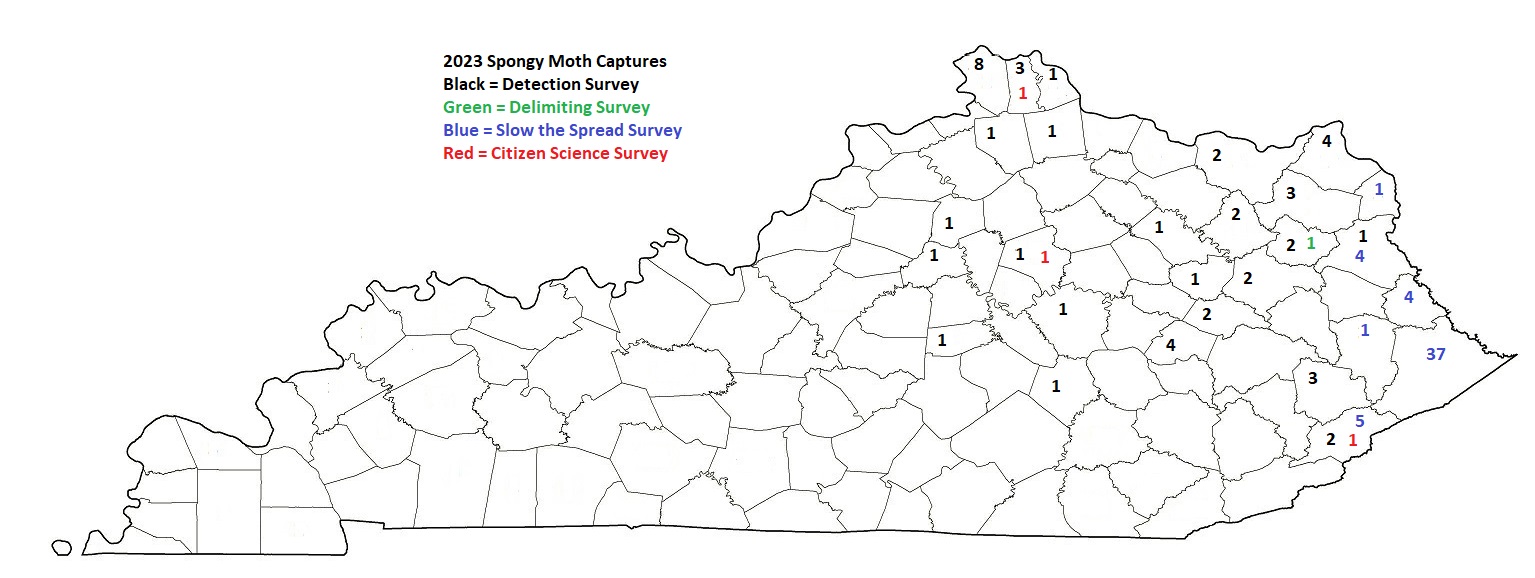
| 2023 |
Detection: 4,615 Delimiting: 125 STS: 539 Citizen Science: 527 USDA: 168 |
Detection: 49 in 24 counties Delimiting: 1 in 1 county STS: 52 in 6 counties Citizen Science: 3 in 3 counties USDA: 0 |
 |
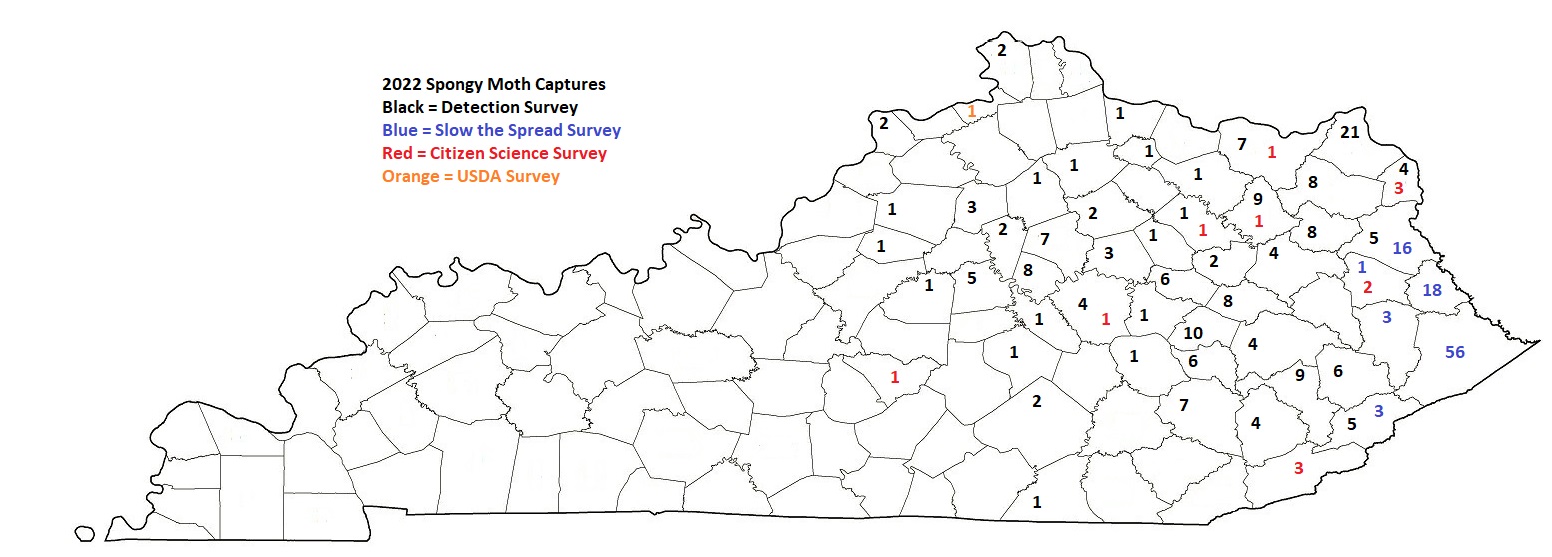
| 2022 |
Detection: 4,659 STS: 457 Citizen Science: 286 USDA: 166 |
Detection: 188 in 45 counties STS: 97 in 6 counties Citizen Science: 13 in 8 counties USDA: 1 in 1 county |
 |
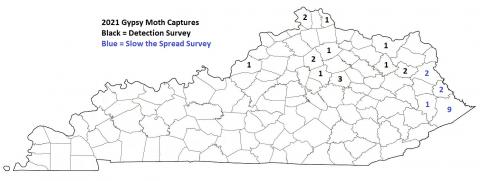
| 2021 |
Detection: 4,849 STS: 484 STS Delimiting: 6 USDA: 152 |
Detection: 15 in 10 counties STS: 14 in 4 counties USDA: 0 |
|
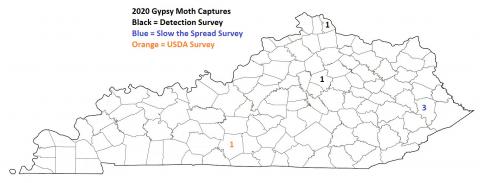
| 2020 |
Detection: 4,659 STS: 733 USDA: 153 |
Detection: 2 in 2 counties STS: 3 in 1 county USDA: 1 in 1 county |
|
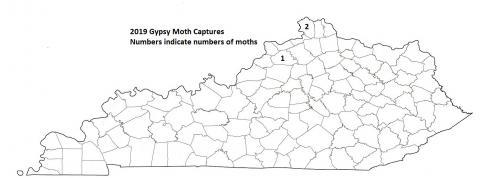
| 2019 |
Detection: 4,308 Delimiting: 4 STS: 661 STS Delimiting: 18 |
Detection: 3 in 2 counties STS: 0 |
|
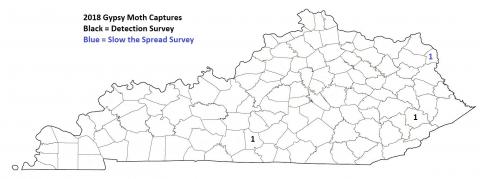
| 2018 |
Detection: 5,619 STS: 596 |
Detection: 2 in 2 counties STS: 1 in 1 county |
|
| 2017 |
Detection: 7,408 STS: 602 STS Delimiting: 19 |
Detection: 10 in 9 counties STS: 1 in 1 county |
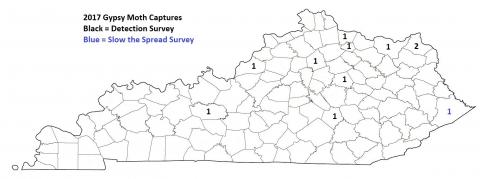
|
| 2016 |
Detection: 7,216 Delimiting: 109 STS: 540 STS Delimiting: 44 |
Detection: 21 in 16 counties STS: 58 in 5 counties |
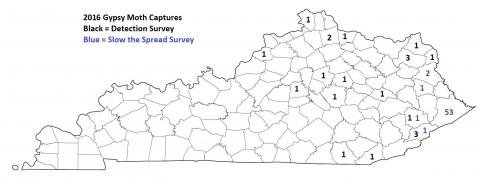
|
| 2015 |
Detection: 7,328 Delimiting: 41 STS: 505 STS Delimiting: 9 |
Detection 84 in 27 counties STS: 86 in 5 counties US Forest Service: 1 in 1 county |
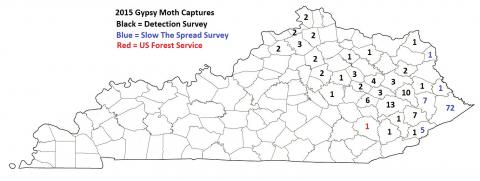
|
| 2014 |
Detection: 7,065 Delimiting: 12 STS: 546 |
Detection: 2 in 2 counties STS: 1 in 1 county |
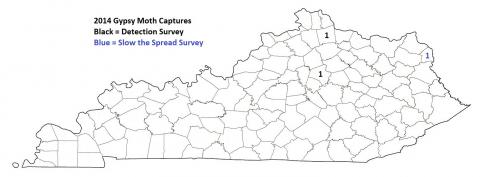
|
| 2013 | Total traps: 2,634 |
Detection: 9 in 8 counties STS: 14 in 4 counties |
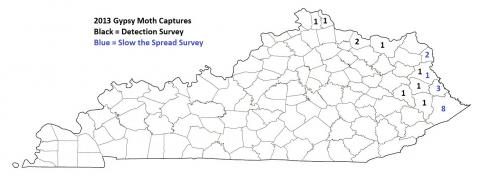
|
| 2012 | Total traps: 2,938 | 8 in 4 counties |
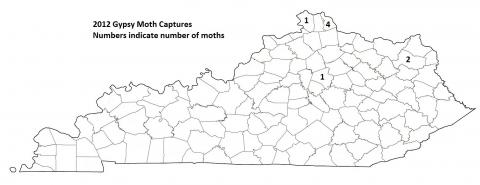
|
| 2011 | Total traps: 4,602 | 23 in 5 counties |
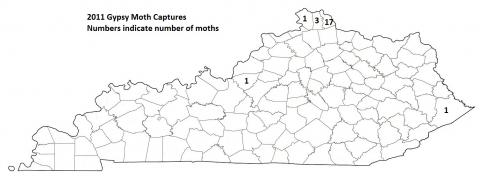
|
| 2010 | Total traps: 4,633 | 42 in 9 counties |
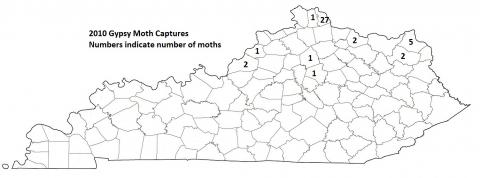
|
| 2009 | Total traps: 7,101 | 88 in 10 counties |
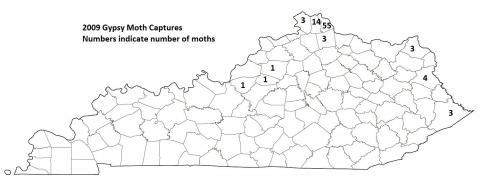
|
| 2008 | Total traps: 5,373 | 181 in 22 counties |
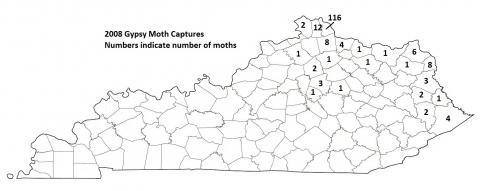
|
| 2007 | Total traps: 6,630 | 212 in 34 counties |
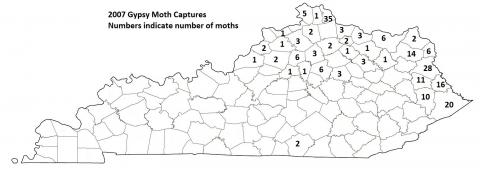
|
| 2006 | Total traps: 7,734 | 130 in 20 counties |
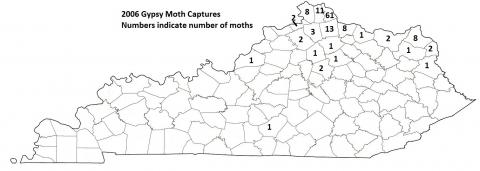
|
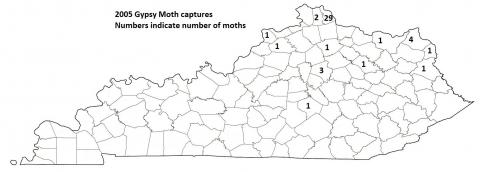
| 2005 | Total traps: 8,830 | 46 in 12 counties |
|
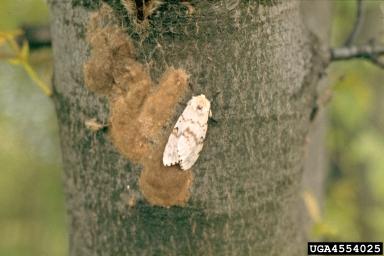
Photo: Petr Kapitola
